Increasing a Logistics SMB's Revenues by $96k a MONTH
07/30/2025
A case study on how my Custom Sales Dashboard quickly boosted a logistics SMB's Revenues
IntroductionI specialize in helping manufacturing and logistics SMBs use their data to improve profitability. One client, a logistics business grappling with unclear sales insights, reached out for support. This case study shares how my Weekly Sales Dashboard made an immediate positive impact on their business.
The Challenge
Before we started working together, my client struggled to track revenue and margins effectively. From June 2024 to January 2025, their average monthly revenue was around $160K, but they lacked the tools to spot trends or opportunities. This made it hard for them to optimize sales operations and improve revenues.
The Solution
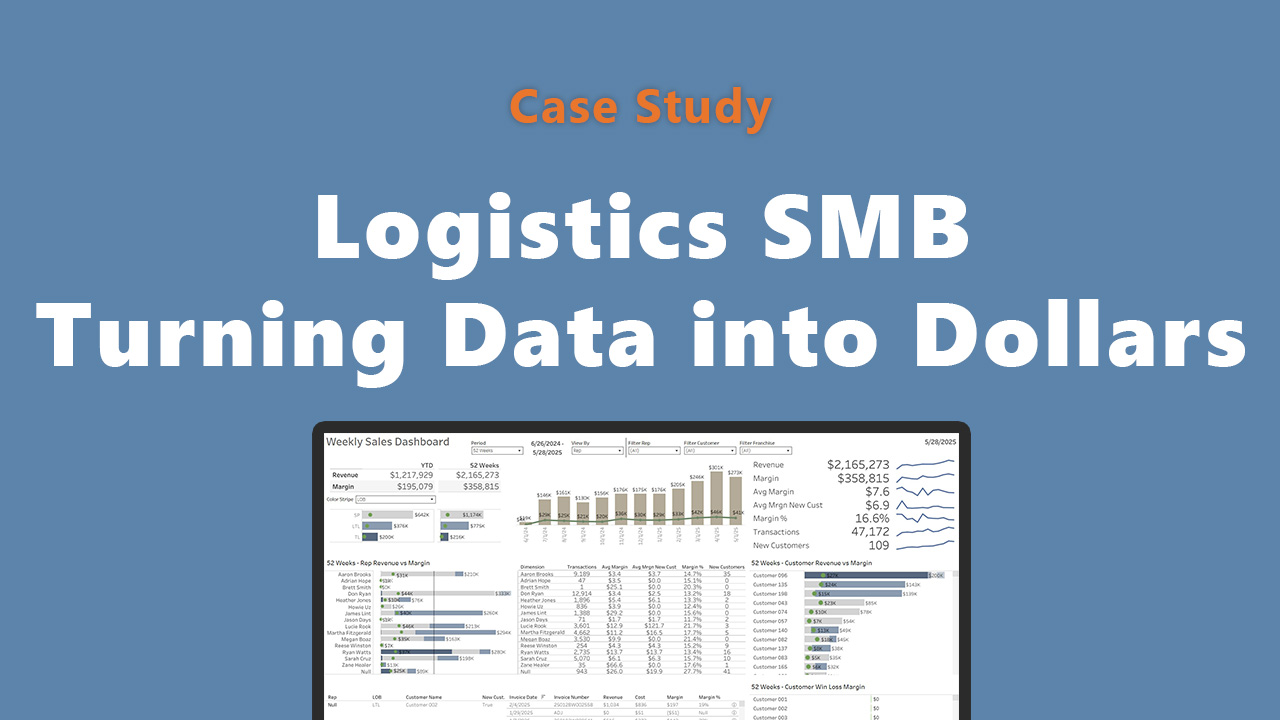
I developed a Weekly Sales Dashboard, rolled out in January 2025, to help address these pain points. The dashboard offers an interactive sales overview, including revenue versus margin analysis, customer performance tracking, and new customer metrics. From day one the client began using the dashboard to gain clearer insights and guide their decisions.
The Impact
The results speak for themselves. Since rolling out the dashboard, my client saw their average monthly revenue rise from $160k to $256k - a solid 60% increase and a total yearly increase of $1.15M. This uplift demonstrates how the Weekly Sales Dashboard empowered my client to make better sales decisions, directly boosting their bottom line.
Conclusion
This Weekly Sales Dashboard’s success shows it can offer practical benefits for other businesses. By turning data into dollars, this tool proves its value in driving profitability. Ready to see similar results for your business? Contact me for a consultation today!
Click the image below to see an anonymized version of the Dashboard

 Long View Analytics